カスタムフィールドに入れた値を元に円グラフを表示するショートコードの作り方。
function.phpに追記
function pie_chart_from_custom_fields_shortcode() {
    $work_hours = get_post_meta(get_the_ID(), 'work_hours', true);
    $eat_hours = get_post_meta(get_the_ID(), 'eat_hours', true);
    $commute_hours = get_post_meta(get_the_ID(), 'commute_hours', true);
    $tv_hours = get_post_meta(get_the_ID(), 'tv_hours', true);
    $sleep_hours = get_post_meta(get_the_ID(), 'sleep_hours', true);

    ob_start(); // 出力バッファリングを開始
?>
    <script type="text/javascript" src="https://www.gstatic.com/charts/loader.js"></script>
    <div id="pie_chart"></div>
    <script type="text/javascript">
    google.charts.load('current', {'packages':['corechart']});
    google.charts.setOnLoadCallback(drawChart);

    function drawChart() {
        var data = google.visualization.arrayToDataTable([
            ['Activity', 'Hours per Day'],
            ['Work', <?php echo $work_hours; ?>],
            ['Eat', <?php echo $eat_hours; ?>],
            ['Commute', <?php echo $commute_hours; ?>],
            ['Watch TV', <?php echo $tv_hours; ?>],
            ['Sleep', <?php echo $sleep_hours; ?>]
        ]);

        var options = {
            title: 'My Daily Activities',
            legend: { position: 'right' },
            is3D: true, // 3D効果を追加
        };

        var chart = new google.visualization.PieChart(document.getElementById('pie_chart'));
        chart.draw(data, options);
    }
    </script>
<?php
    return ob_get_clean(); // バッファリングした出力を取得し、クリア
}
add_shortcode('show_pie_chart', 'pie_chart_from_custom_fields_shortcode');
ショートコード[show_pie_chart]を入れる。
図を2Dにしたいときは以下。(1行コメントアウト)
function pie_chart_from_custom_fields_shortcode() {
    $work_hours = get_post_meta(get_the_ID(), 'work_hours', true);
    $eat_hours = get_post_meta(get_the_ID(), 'eat_hours', true);
    $commute_hours = get_post_meta(get_the_ID(), 'commute_hours', true);
    $tv_hours = get_post_meta(get_the_ID(), 'tv_hours', true);
    $sleep_hours = get_post_meta(get_the_ID(), 'sleep_hours', true);

    ob_start(); // 出力バッファリングを開始
?>
    <script type="text/javascript" src="https://www.gstatic.com/charts/loader.js"></script>
    <div id="pie_chart"></div>
    <script type="text/javascript">
    google.charts.load('current', {'packages':['corechart']});
    google.charts.setOnLoadCallback(drawChart);

    function drawChart() {
        var data = google.visualization.arrayToDataTable([
            ['Activity', 'Hours per Day'],
            ['Work', <?php echo $work_hours; ?>],
            ['Eat', <?php echo $eat_hours; ?>],
            ['Commute', <?php echo $commute_hours; ?>],
            ['Watch TV', <?php echo $tv_hours; ?>],
            ['Sleep', <?php echo $sleep_hours; ?>]
        ]);

        var options = {
            title: 'My Daily Activities',
            legend: { position: 'right' },
            // is3D: true, この行を削除またはコメントアウト
        };

        var chart = new google.visualization.PieChart(document.getElementById('pie_chart'));
        chart.draw(data, options);
    }
    </script>
<?php
    return ob_get_clean(); // バッファリングした出力を取得し、クリア
}
add_shortcode('show_pie_chart', 'pie_chart_from_custom_fields_shortcode');
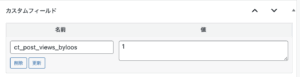
カスタムフィールドを入れる
work_hours
eat_hours
commute_hours
tv_hours
sleep_hours
上のコードではこの5つのカスタムフィールドを作って値を入れると円が出る。ACFとかSCFとかを使うと楽。
以上よろしくお願いします


コメント